Proud partner

Proud partner
Article


Google Analytics is an indispensable web analytics tool for online marketers. After all, monitoring and managing data is crucial to a company’s online success. Whether it’s a start-up or a business that has been operating for years, optimisation remains important, and the available data plays a major role in this. Think, for example, of standard metrics such as visitor numbers, a page’s bounce rate and the number of conversions. However, there are many more ways to analyse data. And Google Analytics helps you do just that.
Google Analytics is packed with useful reports and features that are rarely used but do indeed contribute to a better understanding of the online performance of your website and campaigns. In this article, we’ll take a closer look at the various possibilities within Google Analytics, making it much easier to use this tool!
Before you start interpreting the data in Google Analytics, it is important to define the data range. Which period do you want to analyse? Furthermore, it is wise to always compare several periods with one another. How did your website perform during this month last year? Look at both short and longer periods.
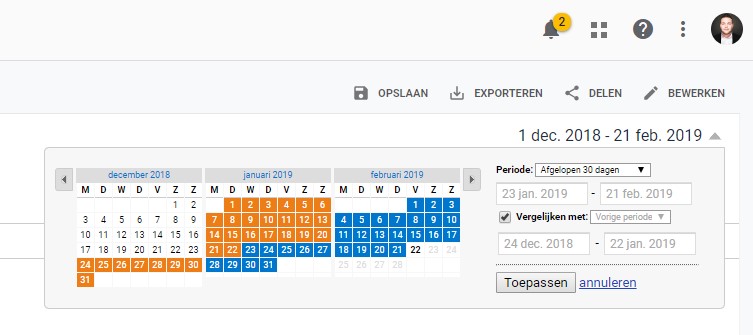
Google’s default setting shows us the results from the past 3 days. This is fine for examining the most recently published pages and analysing changes that have been implemented recently. However, by extending the date range to, for example, three or six months, you can identify broader trends. This puts you in a much better position to analyse organic growth, for instance. It also provides a more complete picture of which pages receive the majority of organic traffic, page views and conversions. Furthermore, it gives you insight into potential variations in data caused by factors such as seasonal changes.
If a website has been online for some time, analysing and comparing data over a period of a year or more is also very useful. For example, it is helpful to see which parts of your website have improved or deteriorated over time and which changes have had a long-term impact.
To make your periodic data even easier to understand, the feature for comparing periods is a smart tool to use. For example, you can compare the last 30 days with the same period a year ago. This allows you to clearly identify whether the website is performing better or worse and which channels or pages have contributed to this result.
Well-designed landing pages play a major role in the success of a website. If landing pages are optimised based on your data, visitors will stay on your website more often and for longer, your website will convert better, and you’ll see benefits such as a higher (Google Ads) quality score and improved organic rankings. You can view a landing page’s performance in Google Analytics. Start by looking at the top 20 landing pages; go to ‘Content > Site content > Landing pages’.
Try to identify the pages with a high bounce rate. It is best to measure this using a longer date range. Take a critical look at these pages. What is wrong with them? Examine this from both a technical perspective and in terms of usability testing. Are there any missing calls-to-action, broken links or insufficient content? Does the content meet the visitor’s expectations, and does the page align well with the promise made in, for example, an advert or meta description? It’s important to experiment with the date range. Does the bounce rate change over a period of time, or does it remain the same? Does the bounce rate rise suddenly, and can you attribute this to a specific change on the website? This can provide you with a wealth of insights.
Another good way to find out why your pages are underperforming is to analyse different segments. For example, you can check whether there are differences between visitors coming from different channels. Take a closer look specifically at paid traffic or organic visitors. This way, you can determine whether something is set up incorrectly in the campaign or whether the page isn’t meeting expectations. Try to learn from the landing pages that are performing well and improve the ones that aren’t. Improving an SEO campaign is primarily a matter of taking action and learning from the data, in order to achieve even better results.
Naturally, you’ll want to know the path a visitor takes on your website. What if we told you there’s a feature that makes this clear to you? You can find the feature for mapping visitor flow under ‘target group > visitor flow’.
The starting point of the visitor flow is how a user has accessed a website. The flow then reaches the first block: the landing page. The lines between different pages show how visitors have clicked their way through the website. These lines can be used to map out which pages an average visitor clicks on and which path the average visitor is likely to follow within your website.
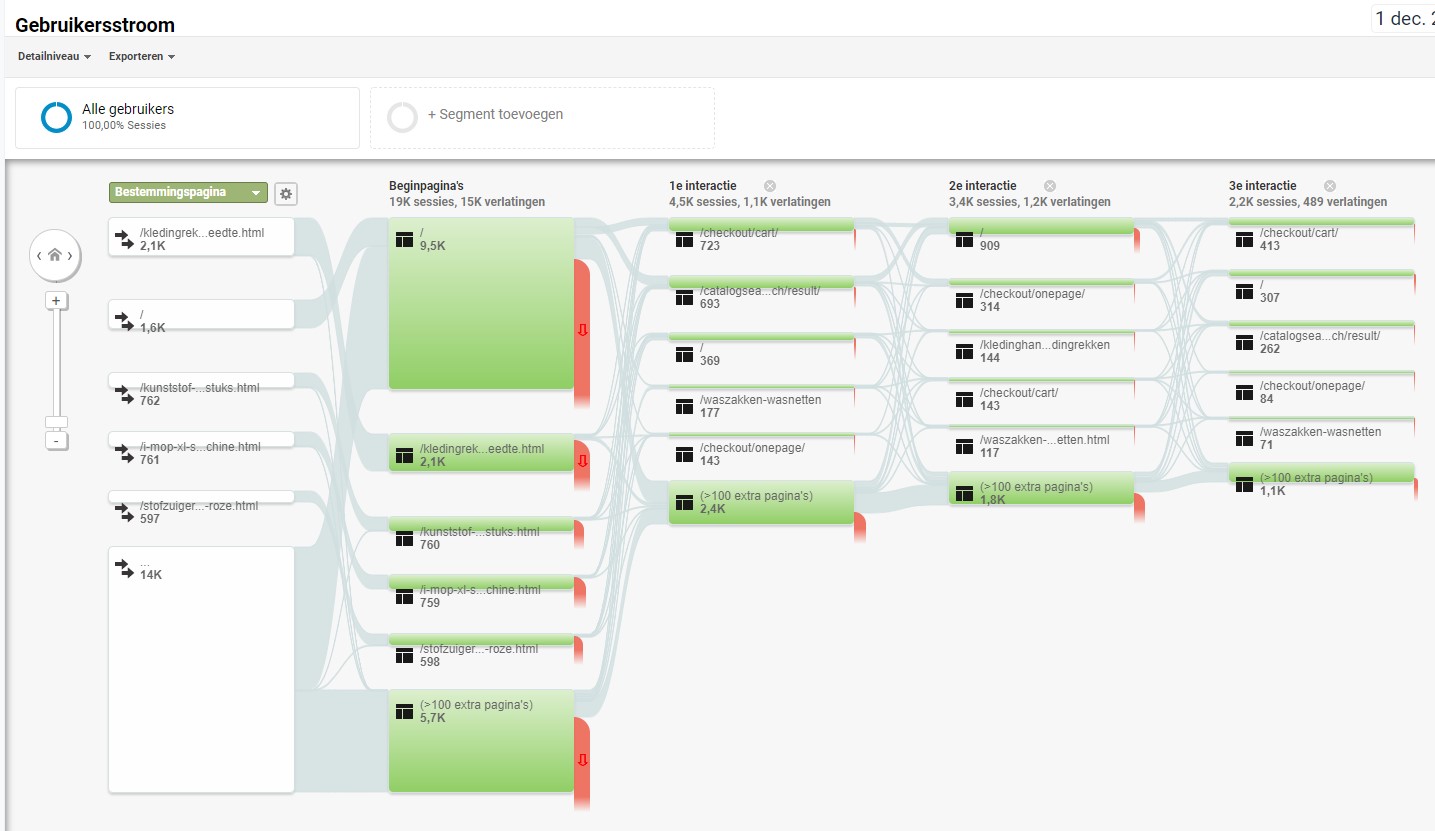
A quick glance at this data often reveals a rather messy picture; don’t worry, this is normal. It may be a bit overwhelming, but this data is actually meant to be a bit messy. This is because thicker lines are used between page blocks when more visitors follow the same route. For example, a thicker line may appear when a blog post is published with a link to another page on your website. In such cases, most users will use the blog post as their landing page. Analysing patterns in visitor flows is valuable for implementing any positive patterns across the rest of your website.
Research shows that 95 per cent of website visitors do not convert on their first visit to a website. On average, it takes visitors 3 to 4 visits to actually convert. So, if you analyse the value of just one channel, you won’t get a complete picture of how the conversion came about. It is likely that multiple channels ultimately contributed to a specific conversion. To better understand the customer journey, you need to examine customers’ conversion paths in Google Analytics. To identify the best conversion paths, look under ‘Conversions > Multi-channel Funnels > Top Conversion Paths’. You can also view a number of other reports, such as: ‘assisting conversions’, ‘time lag’ and ‘path length’.
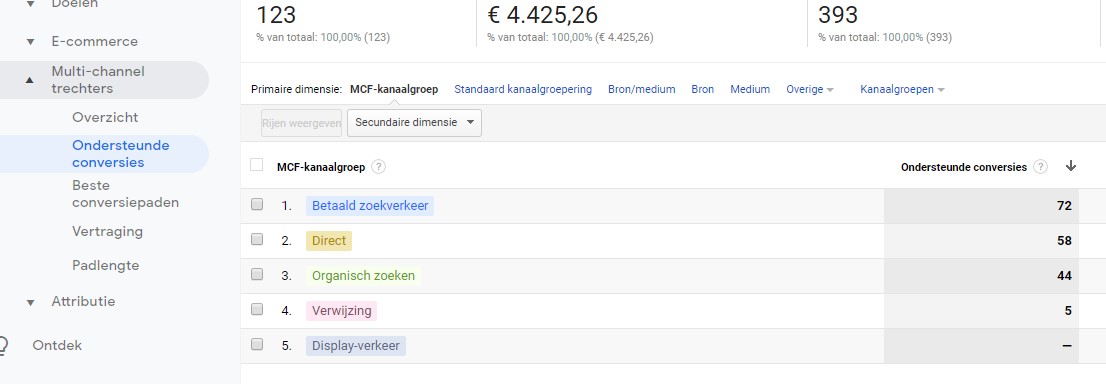
The next option is ‘assisted conversions’. Assisted conversions refer to the number of conversions where a particular channel or source influenced the process, but was not the ultimate source or channel for those specific conversions. For example: an assisted conversion occurs when a visitor leaves the site after arriving via Google Ads, then returns after clicking on an organic result, and subsequently converts. This data can be viewed via ‘Conversions’ > ‘Multi-channel funnels’ > ‘Attributed conversions’ to find the report on attributed conversions.
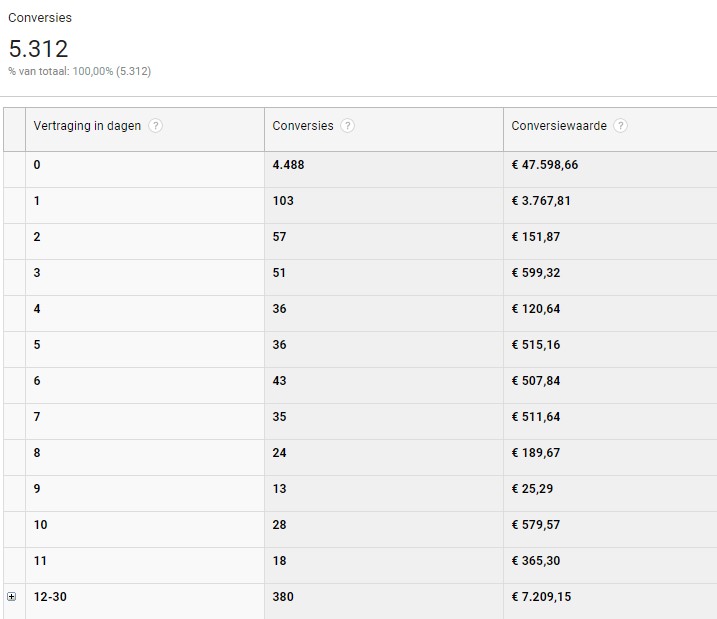
Finally, you can choose between ‘delay’ and ‘path length’. The ‘delay’ metric in Google Analytics tells you the number of days it takes your visitors to complete the final conversion after their first interaction. The ‘path length’ report in Google Analytics indicates how often a user has returned to the site to eventually complete a final conversion.
The standard reports mentioned above naturally provide a good basis for analysing data. In addition to these standard reports, Google Analytics also allows you to combine data yourself to create customised reports. These reports enable us to combine the necessary data to arrive at the ideal set of insights. Within Google Analytics, you’ll find the option to create a custom report in the vertical navigation menu.
When creating a custom report, there are various options available. When setting up a custom report, you select the type of custom report, the statistics group, the dimension details, the filters and the views. This ensures that a bespoke report can always be created. These reports are easy to share and reuse. We’d be happy to share some sample reports with you to give you a starting point when you begin working on your own.
If your website uses a funnel, this is the first step you should take. This report shows you where and how much traffic drops off at each stage of the funnel.
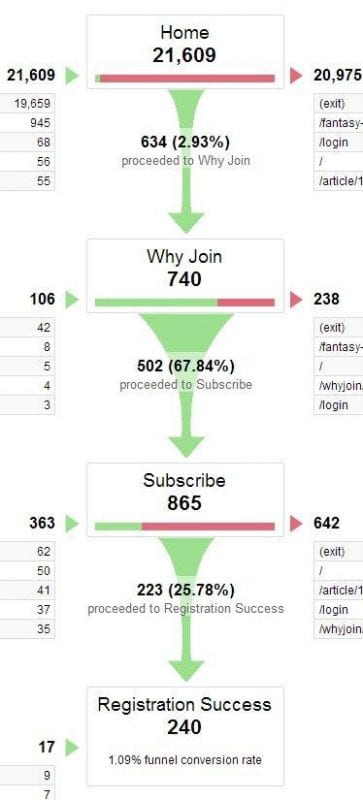
Looking at this funnel, it is immediately apparent that a significant amount of traffic drops off in the first stage. Of the visitors to this page, only 2.93 per cent convert. Despite this low percentage, we cannot immediately conclude that this is where the problem lies. Perhaps the homepage is performing well, but the traffic arriving there is irrelevant or uninterested in the product.
Let’s assume that the homepage is working well and that 3 per cent of the traffic is high-quality traffic. If you look further down the funnel, you’ll see that the ‘subscribe’ page is actually the step with the lowest conversion rate. Before visitors reach this page, they have already gone through two steps in the funnel. This would suggest that the visitors are indeed interested. A conversion rate of 25 per cent on a checkout or registration page is rather poor. The step that should therefore be optimised first is this page.
Note: Always check that the funnel is set up correctly before you start working with it. For example, go through the steps in the funnel yourself once more, or check whether the conversion rate at each step isn’t too good to be true.
It is not uncommon for a website not to work properly with every browser. This can apply to desktop, mobile and tablet devices alike. Take a look at the conversion rate per browser. It is important to break down the browsers into different versions, such as IE11 vs IE10 vs IE9, etc. A report might look like this:
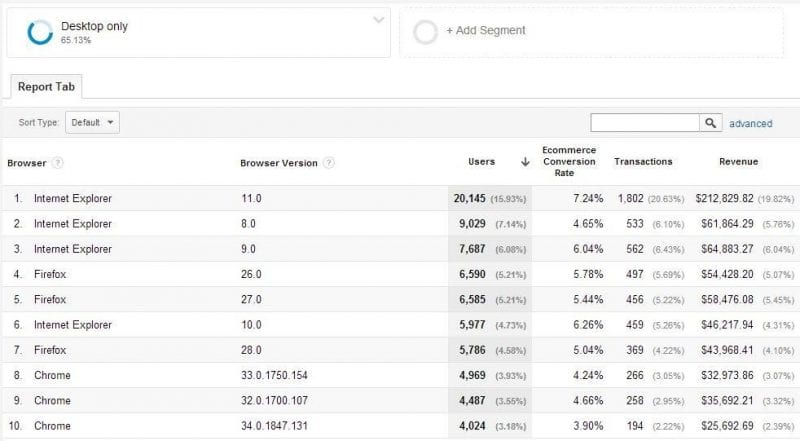
When analysing this data, it is important to break it down by device category: desktop, mobile and tablet.
In the report above, we can see that the conversion rate for IE11 is 7.24 per cent and for IE8 a mere 4.65 per cent. This difference is too great, so there is scope for improvement here. It is important to test the website in an IE8 version in order to identify the bug.
An important point to note regarding this report is that you should not analyse reports with fewer than 100 conversions per browser version. If this is the case, extend the time period.
This step is similar to step two, except that it is device-specific. Here, we examine whether certain issues arise with specific devices, such as a Samsung Galaxy S8 or an iPhone 7. To begin with, we first look at the conversions per device category:
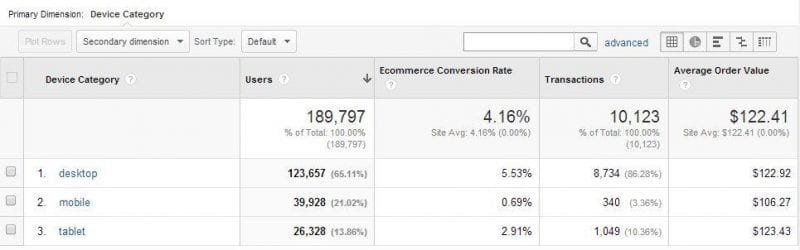
This report immediately shows that conversion rates can vary. This is almost always the case. Experience shows that tablet conversion rates are fairly similar to those for desktop. Mobile conversion rates often lag behind somewhat. However, mobile screens are getting bigger and bigger, and improvements are being made in this area too.
If most visitors access your site via mobile, it is important to start here. Since the introduction of mobile-first indexing, it is also vital that the mobile site performs well. If the website does not yet have a responsive design or a good mobile site, it is essential to start with this. If you already have this in place, you can get started by analysing mobile/tablet conversions by operating system:
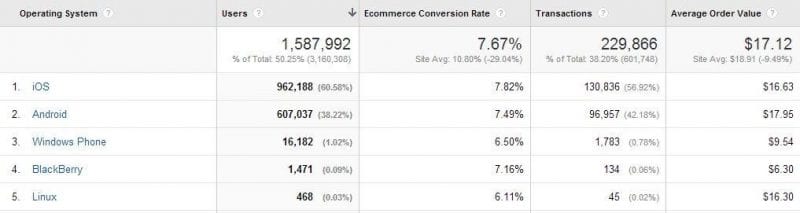
Sometimes we see significant differences in device operating systems. This indicates that there is a bug somewhere on the website. In the report above, everything is in order, so we will now move on to specific devices, such as Android phones:
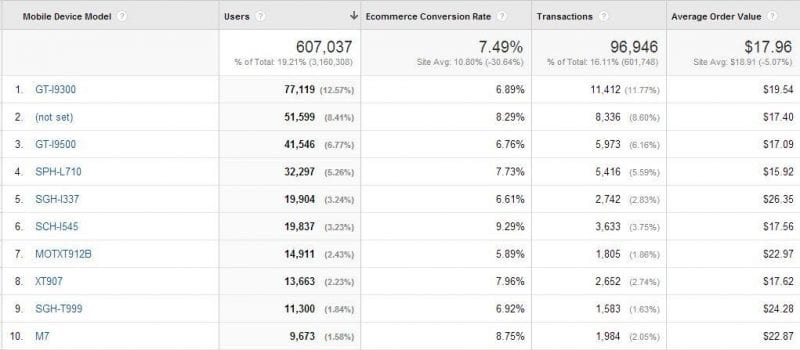
From this, we can see that device #6 converts best with a rate of 9.29 per cent, whilst device #7 has a rate of 5.89 per cent. But what does this actually mean? To understand this better, let’s make it a little more visual:
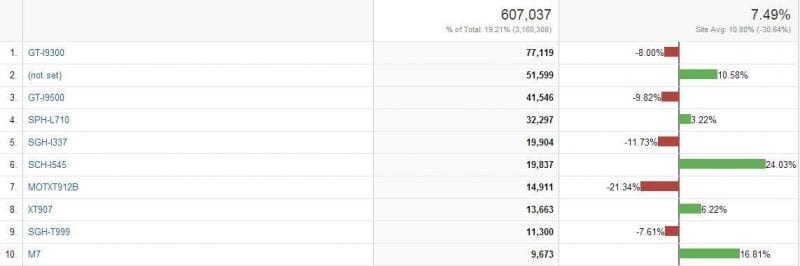
By using the comparison option, it becomes easier to see by what percentage a particular device underperforms compared to the average. It also makes it easier to calculate the potential ROI for underperforming devices.
Note: Here too, it is important that you have collected sufficient data and do not attempt to optimise based on low figures.
When you’re working hard to drive traffic to your website, you naturally want to know where that traffic is going. As well as being interesting to know which pages your visitors go to, it’s also very useful to know on which pages they drop off.
You can view this data by going to ‘Behaviour’ > ‘Site Content’ > ‘All Pages’.
In this overview, you can view your top 25, 50 and 100 traffic pages. Which pages are people leaving? If you then click the ‘compare’ button, you can view both the bounce rate and the exit rate (the bounce rate applies to visitors arriving from an external link, whilst the exit rate applies to those arriving from an internal link).
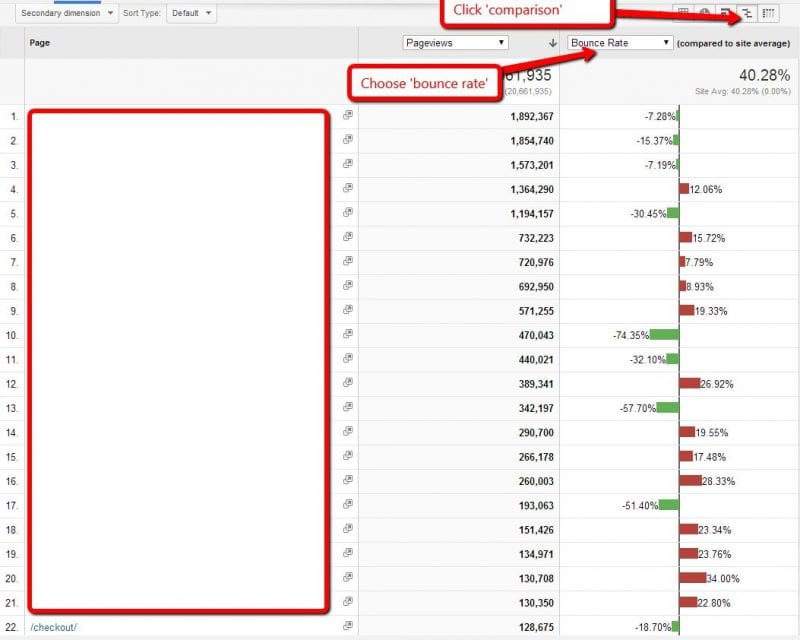
This allows you to create a clear overview of pages that are underperforming or not performing at all. You can then compare these with the high-performing pages to see if there are any differences. Based on this, you can make adjustments to the underperforming pages, thereby reducing the bounce rate and exit rate.
Visitors to your website use a variety of devices to access it. This means that users also have different screen resolutions. In Analytics, you can compare bounce rates and conversion rates by screen resolution. This can provide valuable insights into specific ‘leaks’ on your website.
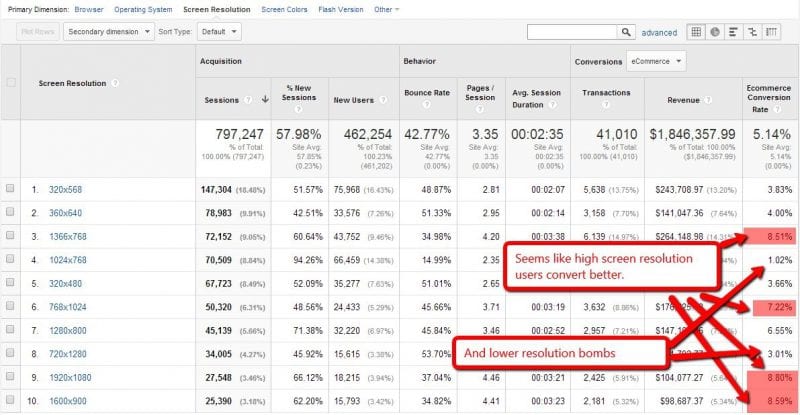
Naturally, the data you collect provides you with certain insights. Based on these insights, you can then determine what steps to take to improve your website.
From the data above, it therefore appears that users with high-resolution screens convert better. The next step is to find out why this is the case. Do they perhaps have more money? Or do people with low-resolution screens have a poor user experience on your website? This is, of course, entirely possible, and it is up to you to optimise your site based on these findings.
So pay close attention to screen resolutions associated with high bounce rates and low conversion rates. Identify these pages and use this information to draw up a plan that allows you to act on the data you have collected.
Another useful report you can use in Google Analytics is the number of conversions per traffic source. This report allows you to identify which traffic sources are effective and which are not – and may well be a waste of time.
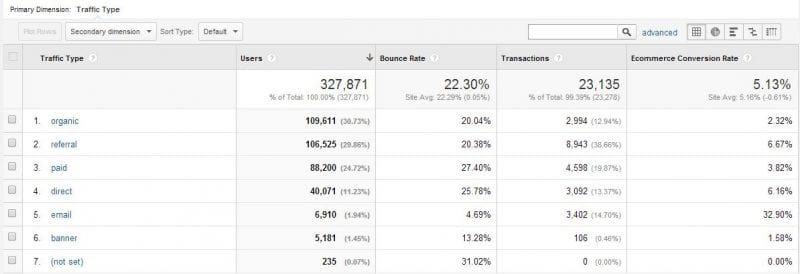
One of the easiest ways to improve your conversions is to avoid irrelevant, poor-quality traffic and focus on channels that actually work. This overview will therefore help you to set up your marketing plan effectively.
For example, the image above shows that ‘email’ has a very high conversion rate. This is therefore a channel that works very well, and one you’ll want to use more often. Banners have a very low conversion rate, so you can conclude from this that you might not need to use this channel at all. You can then use the time you save on this to focus on email, so that you can get even more out of it.
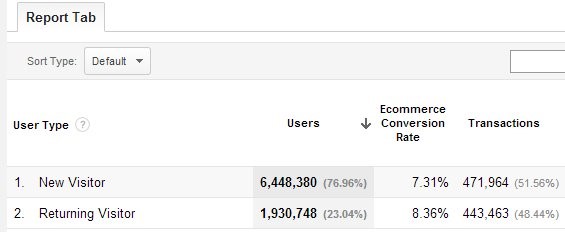
The ‘new visitors vs returning visitors’ report in Analytics is also a useful overview that helps you identify where your website is losing revenue. For example, you may be losing revenue from new visitors because you are trying to sell too aggressively to this target group.
There doesn’t always have to be a big difference between new visitors and returning visitors. But if you find that this is the case, you need to respond accordingly.
Little difference:
A big difference:
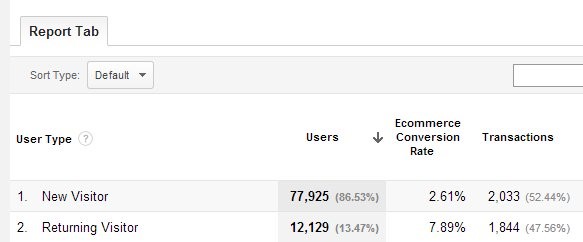
Using the information above, you can draw up a plan to approach new visitors in a different way. After all, you know that once they become returning visitors, they are highly likely to convert more.
In this case, for example, you could run an experiment where you focus on collecting email addresses from new visitors. You can then set up targeted email marketing campaigns to encourage these visitors to return to your website, with the aim of getting them to place an order this time. This allows you to collect new data, which you can then use to set up further experiments.
As online marketers, we spend every day optimising campaigns based on data. It is essential to use the right data, for example, if you want to implement call tracking. In the article above, we have provided a few examples of commonly used features in Google Analytics. However, we must not forget that Google Analytics offers a vast array of possibilities for combining data. There may be too much information to process straight away, so always focus on the end results.
Would you like to know more about making the most of Google Analytics? Or do you need help with the online marketing of your website? Please feel free to get in touch with us.




Our team is
ready to help you