Proud partner

Proud partner
Article
Summary


As many are unfortunately aware, Google Analytics 4 is quite different from what you’re used to. Whereas UA (Universal Analytics) took a linear approach, GA4 offers much greater flexibility by basing its model on events. However, this also requires a different way of interpreting the data. In this blog, I’ll explain a number of ‘basic’ concepts, reports and features, so you can get started!
Before I delve into the reports, it is important to understand the ‘scopes’ in GA4. Scopes are the levels at which data is collected and analysed. In GA4, there are three scopes: User, Session and Event.
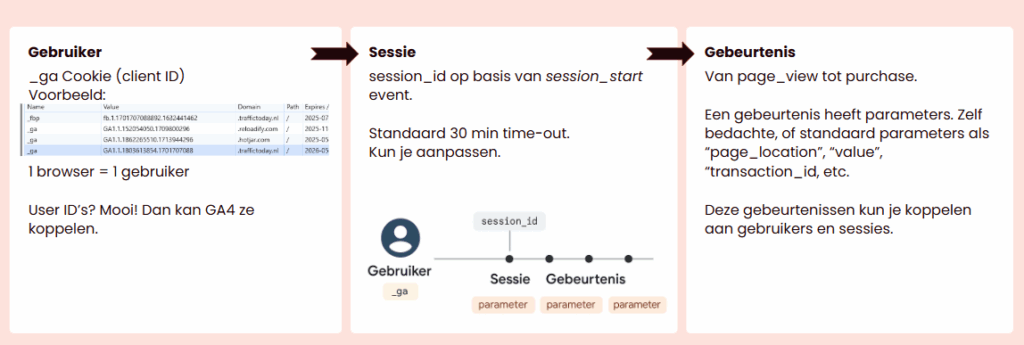
The user scope is the broadest of the three. Here, GA4 looks at a single unique user who may have had multiple sessions within a given period. This is ideal for analysing returning customers: how often do they make purchases, through which channels do they return, and what behaviour do they exhibit over a longer period?
Please note: Ensure you include user IDs correctly in your tag setup if you wish to make the most of this feature.
The session scope covers everything that happens during a single visit. A session begins as soon as the `session_start` event is triggered, usually immediately when someone lands on your website. By default, a session lasts 30 minutes, unless the user remains active during that time. You can also adjust this timeout.
Ask yourself: how long does the average visit to your site last? Your session settings would be better tailored to this.
The easiest scope to understand. In GA4, everything is an event: a click on a button, a purchase, scrolling or a form submission. You can link parameters to these events, such as the purchase value, product name or the ID of a submitted form.
Below, I’ve included a handy table that briefly summarises the different scopes and, as a bonus, tells you where you can find them within a number of commonly used reports!
| Scope | What do you ‘see’? | Sample question | Which reports |
| User | Data across multiple sessions by the same user. | How often do returning customers make purchases? | User acquisition, cohort analysis |
| Session | Everything that happens during a session. | Through which channel did the session come in? | Traffic acquisition, E-commerce |
| Event | Individual actions. (Add to basket, purchase, click) | How many times has a button been clicked? | Events |
Pro tip: always know which scope level you’re looking at before drawing conclusions. A single user can have multiple sessions, and a single session can have multiple events. Do you understand that structure? Then you understand the data.
If you’ve ever had a look around GA4, you’ve no doubt come across the following reports:
If you’re a bit more advanced or work with an agency like ours, there’s a good chance these reports have been customised or enhanced. But even the standard reports are very powerful, if you know how to read them.
This report shows which channel users usedto first arrive at your website via . Everything that user does subsequently, such as purchases and other events, is still attributed to that initial channel.
It is best not to use this report to assess channel performance. This is because the user acquisition report looks at first-click attribution. For example: a user arrives via an organic channel on their first visit, but in subsequent sessions clicks on paid adverts twice and eventually converts. In this report, that conversion is still attributed to ‘Organic’. You therefore won’t see the contribution of the paid campaigns, even though they did indeed help.
This report shows which channel a session was initiated through. In other words: how did people find their way to your site during a specific visit?
GA4 uses the ‘last non-direct click’ model here. This means that the channel used immediately prior to any direct visit is treated as the source channel, unless absolutely no other information is available.
An important detail: the report shows sessions, so if a user visits your site via multiple channels (for example: first via social, then via SEA, then via direct), that same user is counted multiple times, separately for each session. And if the conversion takes place in only one of those sessions, it will be attributed to that session alone.
Many sessions are shown as ‘direct’ because no UTM tags have been used, or because tracking has been blocked by, for example, Safari, ad blockers or a refusal to consent to cookie banners. ‘Direct’ therefore often simply means: GA doesn’t know.
In this report, you can see for each item how often it has been viewed, added to the basket and purchased.
Use dimensions such as item_name, item_id, and session_source/medium for accurate analyses.
It is therefore important that your dataLayers are set up correctly! Unfortunately, in my experience, this is often not configured properly, which is a shame. If you do have this properly organised, you can quickly and easily see whether products are worth keeping in your (online) range.
Please note: filtering by channel in this report is a common pitfall.
GA4 analyses this from the event scope and retrospectively links events to a session or source. This is not 100% accurate. You should therefore use this report primarily as an indication of overall performance, but do not draw firm conclusions about channel contribution from it.
Want to know which channel gets credit for conversions? Then this is the report for you.
Choose between Last Click and Data-Driven models. Ensure that only truly relevant events are marked as conversions, otherwise you’ll end up with diluted insights. Tucked away in the top-left corner, you can check the desired event separately.
In my view, the real strength of GA4 lies in ‘Explore’. Here, you can build reports entirely yourself using data as it appears in the database, often without sampling.
Explore handy ready-made reports:
I myself regularly get the chance to dig deeper than the standard reports and dashboards. This allows me to check whether my new tagging techniques are working or not, and to analyse data in greater depth by filtering on specific pages and/or user groups!
Taking everything literally: Analytics is a programme that applies rules based on the data it receives. That does not mean this is the truth. It is an approach. Furthermore, you now know that reports differ in structure. One report has a different scope to another. So always check that you are comparing like with like.
Relying on ‘Direct’ traffic: As mentioned above, ‘Direct’ is often a catch-all category for missing tracking data. The most common causes are the absence or incorrect configuration of Consent Mode, a lack of UTM tags, or technical limitations. If you need help or would like some advice, please do get in touch. We’ll look at your challenges together and help you move forward!
Incorrect use of filters: Using session-level segments when you want to analyse user behaviour? This causes confusion and can skew your data. So pay close attention to which dimensions and metrics you cross-reference in Explore.
Bonus tip: regularly check your UTM tags, cookie settings and whether your site events are being recorded correctly in DebugView. Not sure how? I’d be happy to help with that too. Request a no-obligation audit via our contact form. Who knows, we might be in touch soon 😉
Our data specialists know exactly what to look for. So if you’re still struggling to find the right solution, we’re here to help! Please feel free to get in touch with us.



Our team is
ready to help you