Proud partner

Proud partner
Article


Generating more revenue is something every entrepreneur wants. In addition to utilising SEO and SEA, amongst other things, conversion optimisation is also a key aspect of online marketing.
To keep our knowledge up to date, we attended Emerce Conversion 2019 this year. Here, interesting speakers shared their experiences in the world of CRO. For example, Tom van den Berg from Online Dialogue gave 10 tips on how to increase the ROI of your CRO programme, whilst Jurrien Schouten from FonQ shared 5 tips on how to gain greater insight into visitor behaviour. It was an interesting day full of new insights that we can put into practice straight away to take conversion optimisation to the next level. We do this, amongst other things, by using various tools. The tool that online marketers Marthe and Dominique would like to highlight today is Hotjar.
How does a visitor navigate the website? At what point in the funnel does the visitor drop out? Are there certain website elements that aren’t working properly? These are all questions we’re keen to find answers to. To gain more insight into visitor behaviour on your website, we use the mouse tracking tool Hotjar. Hotjar has various features that will help you understand your visitors better from now on:
We explain these components below to clarify matters.
A heatmap is a graphical representation of data that shows which elements on a page are the most and least popular. It provides insight into how visitors interact with a specific page, which helps with further optimisation.
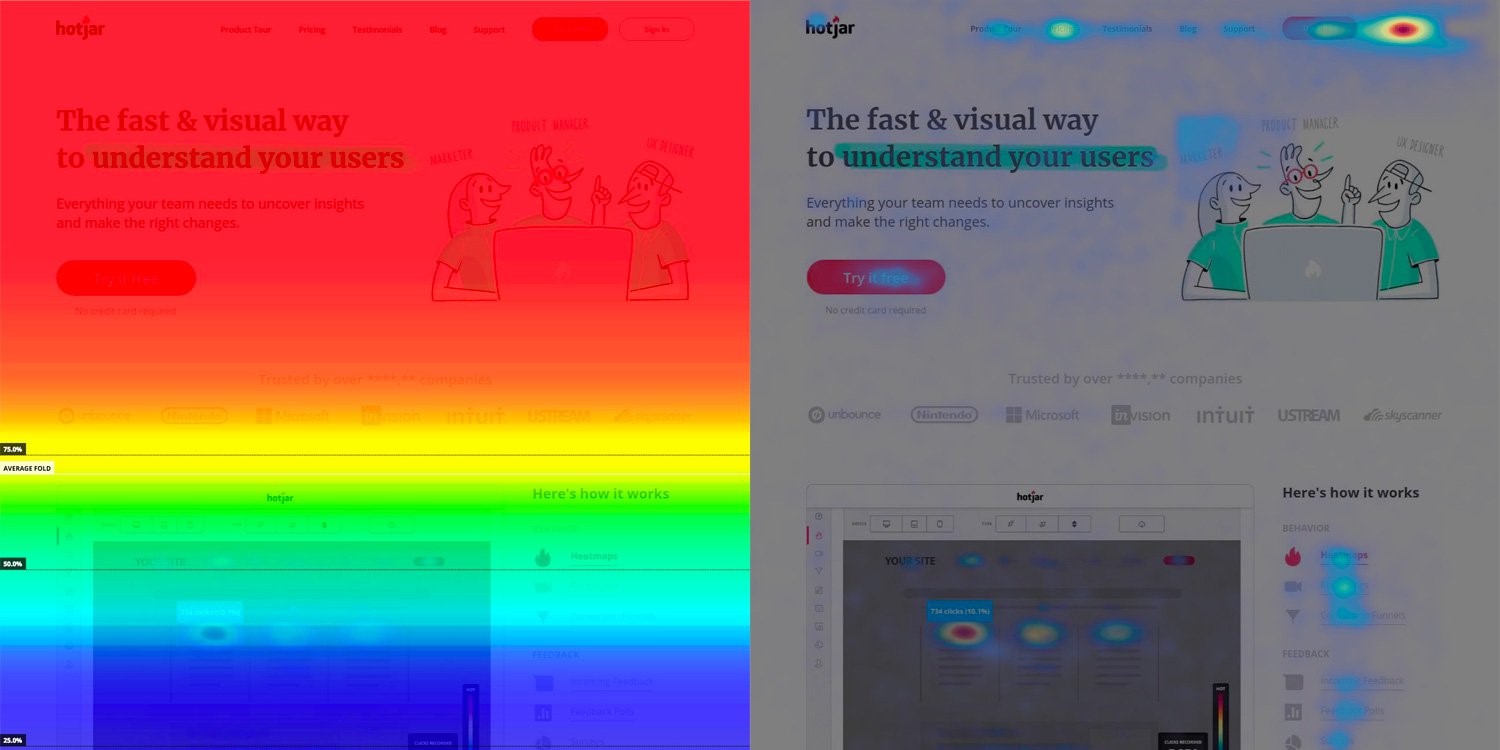
Different colours are used to show how popular an element on the website is. The colours are used on a scale from red to blue. In a heatmap, the most popular elements – those receiving the most interaction – are displayed in red. This allows you to see immediately where visitors are clicking, scrolling or ignoring content. Thanks to the range of device options available, it is possible to compare a page’s heatmaps across different devices.
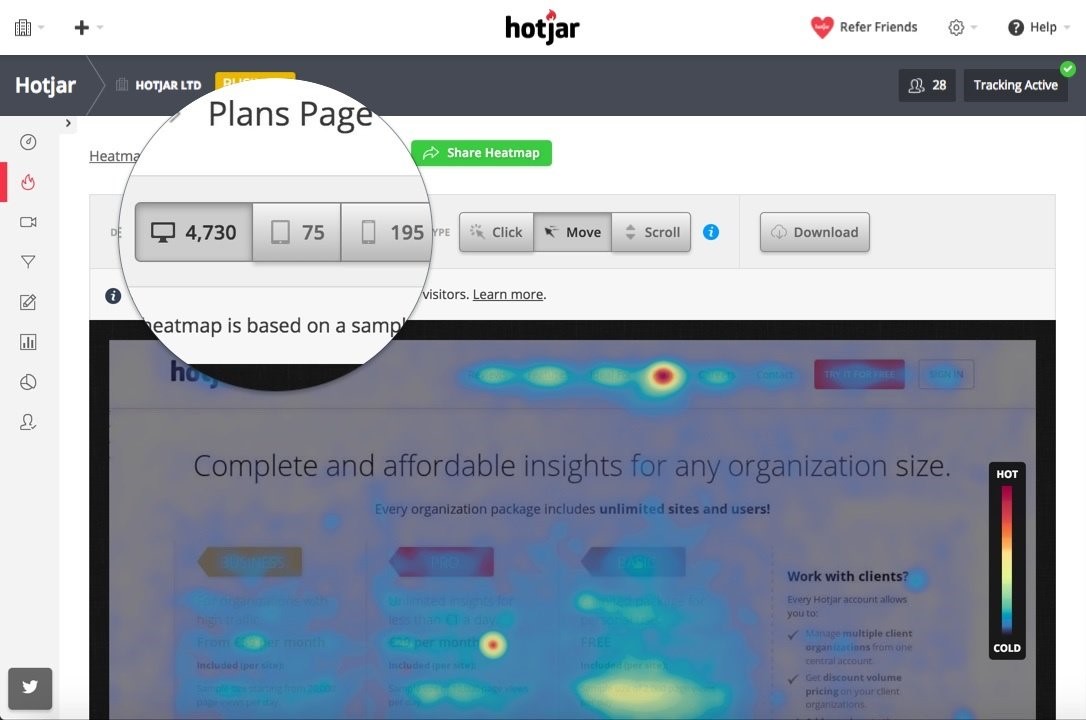
In Hotjar, you can use three different heatmaps:
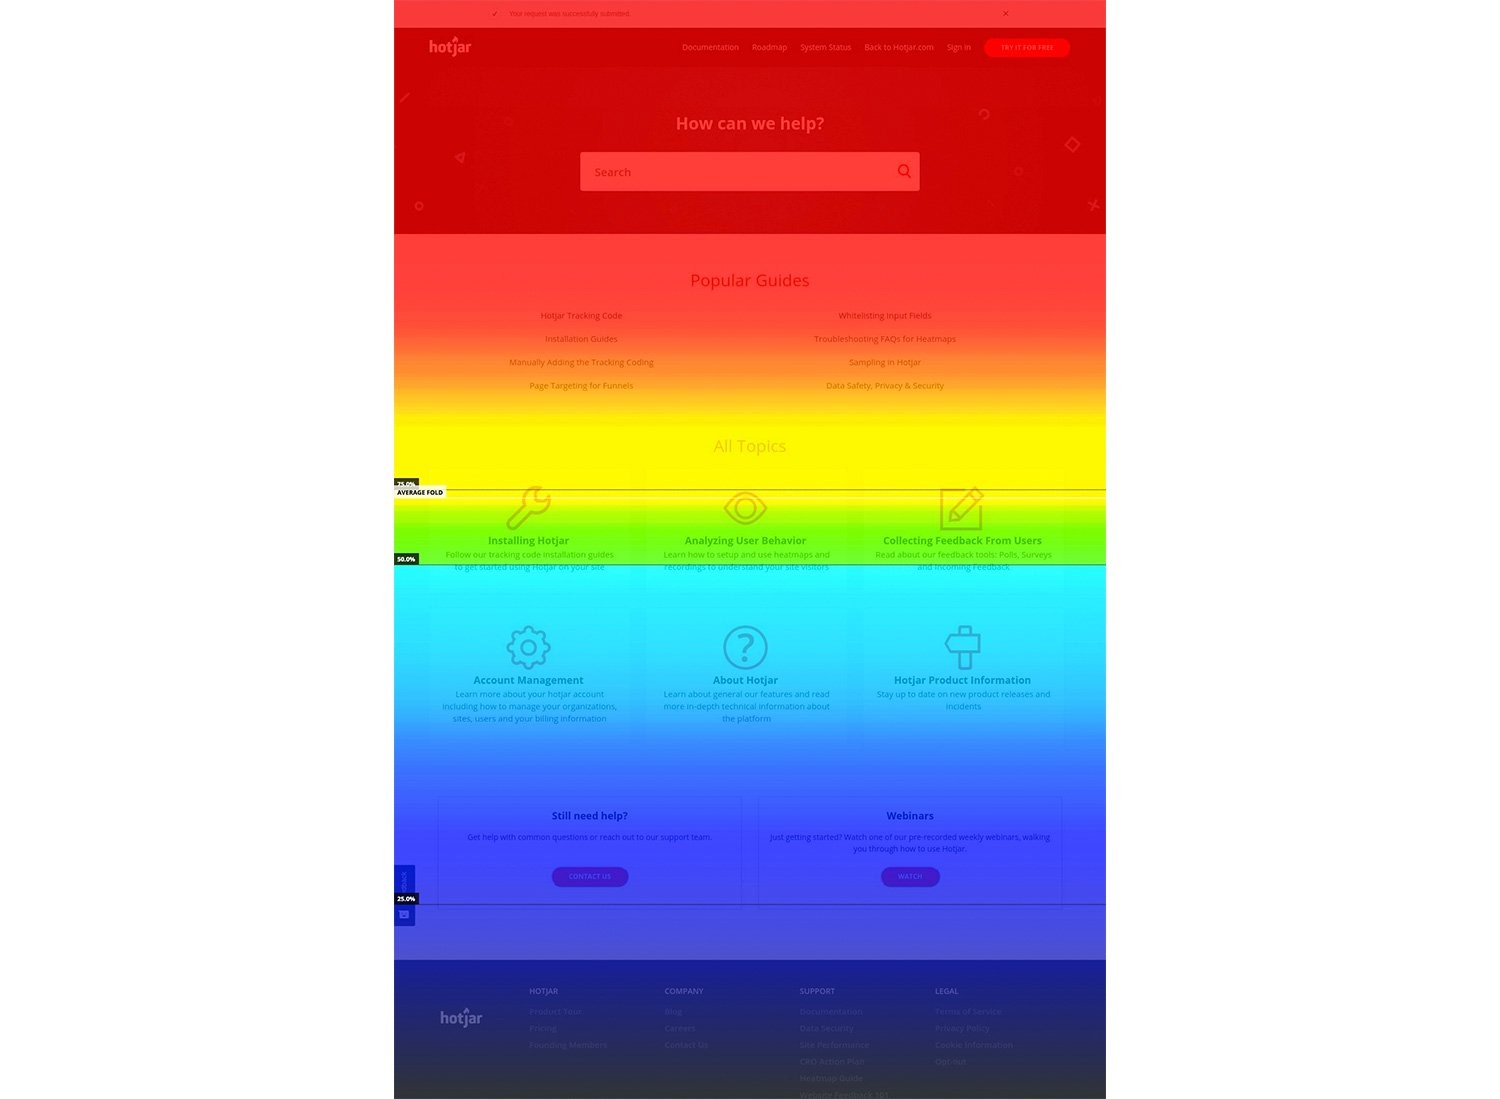
A scroll map shows the exact percentage of visitors who scroll to a specific point on the website. The redder the website, the more visitors have viewed that section.
A click map shows a collection of locations where visitors click on a particular page. On a desktop, this refers to a mouse click, whilst on a mobile phone it refers to a ‘tap’ with the finger on the screen. In this case, it is also referred to as a touch map rather than a click map.

The third variant is a move map. A move map illustrates how a desktop visitor navigates the website with their mouse. The red areas on the move map indicate where the visitor pauses their mouse. Research shows that people move their mouse in the direction they are looking. This means that the move map provides an indication of where the visitor is looking on the page.

What are the benefits of a heatmap? Heatmaps help you understand how visitors behave on your website. This can help answer crucial questions such as ‘Why aren’t my visitors converting?’. Heatmaps can help you determine whether visitors:
By using session recordings, you no longer have to ‘guess’ how visitors behave on your website. It provides immediate insight into click, tap and mouse behaviour. You can more easily identify any specific issues that visitors encounter.
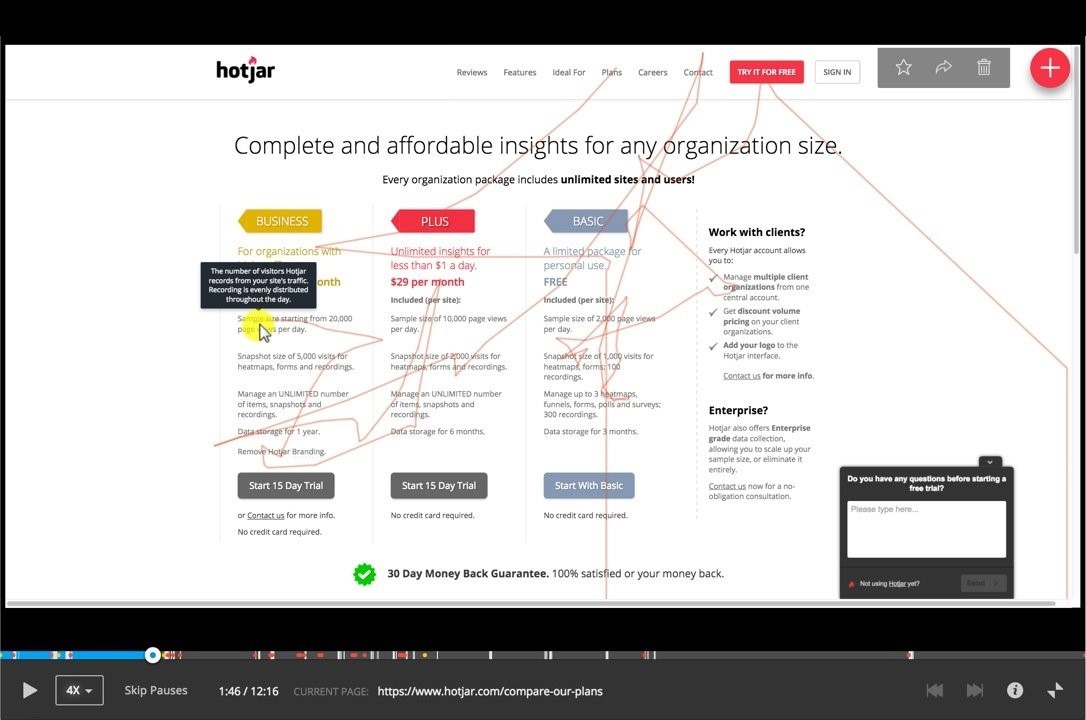
By using Hotjar’s session recordings, you can:
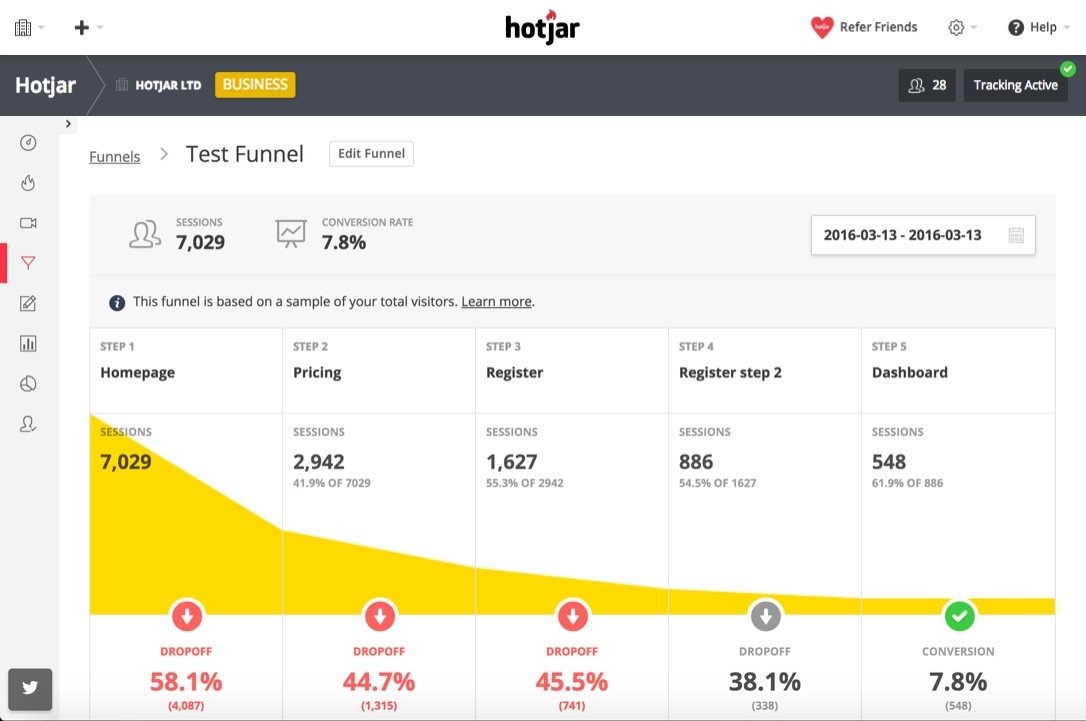
When using Hotjar, you can utilise the conversion funnels feature. This function allows you to set up your funnel to reflect how visitors navigate your website. Here you’ll find the greatest opportunities for improvement and testing by identifying on which page and at which point in the funnel most visitors drop off.
If you use session recordings, you can also review recordings of visitors who drop off.
In addition to the analytics features within Hotjar, there are also feedback options. These allow you to ask visitors directly about their experience of the page they have visited. This feedback complements the analysis capabilities mentioned above, as it engages the conscious part of the brain. Why did a visitor make that choice? Or why not another choice?
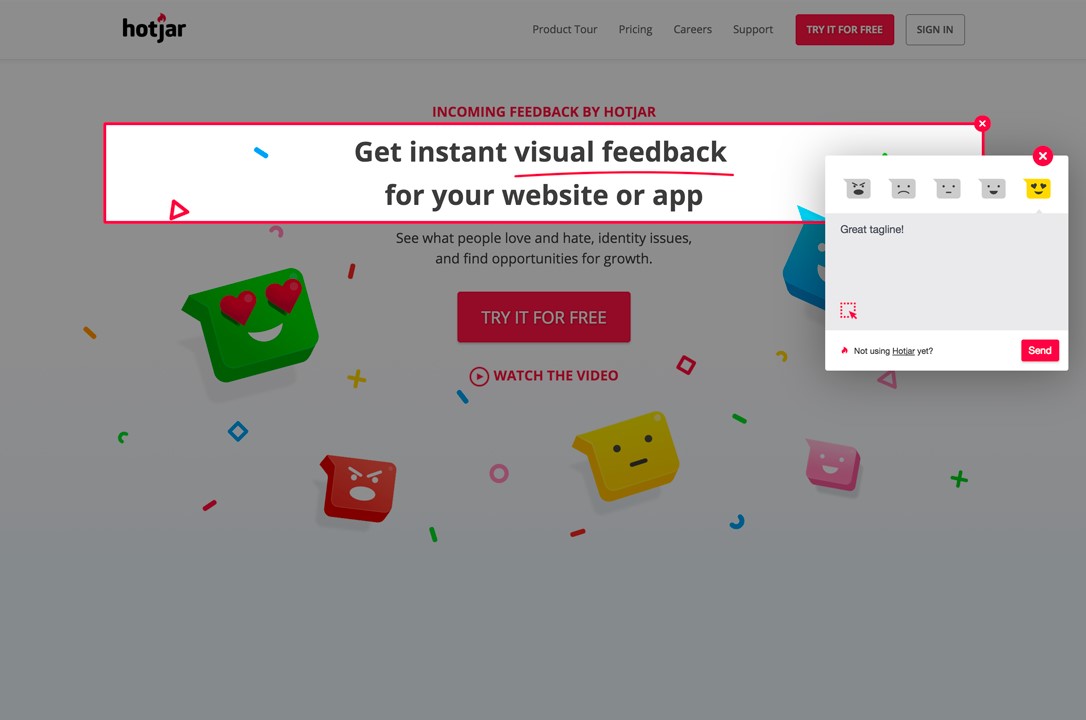
Through the ‘incoming feedback’ feature, visitors can easily provide immediate visual feedback on a website or app. This allows you to see what visitors like and dislike, and what problems they encounter. These negative experiences can be turned into opportunities for growth. For example, you can ask about the performance of specific changes, or the new brand identity can be the subject of feedback. A visitor only needs to click twice to leave their feedback on the website. Easy, isn’t it?
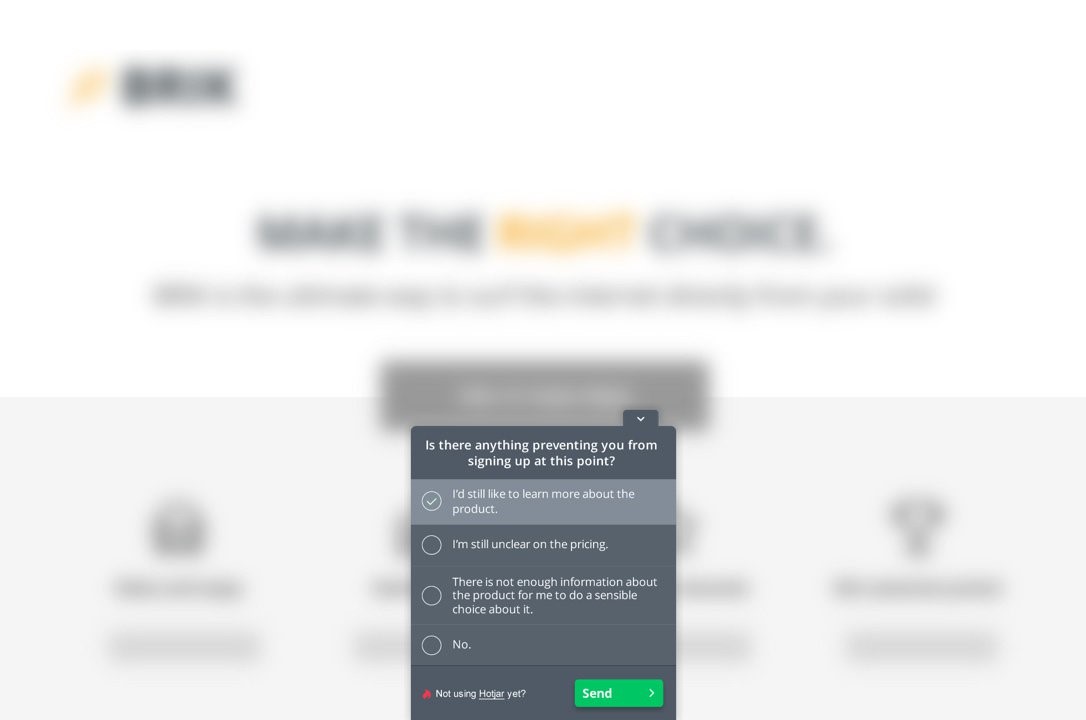
A poll can be used to gain insight into the reasons behind visitor behaviour. After all, improving a website’s performance and user experience starts with understanding what visitors think. In a poll, questions can be tailored to specific visitors and their experience on the website and its mobile version. A short question can be asked at any time within the website. This can be done in two ways: ‘on-action’ and ‘on-exit’. With ‘on-action’, a question is asked following a specific action on the website; with ‘on-exit’, a question is asked when the visitor leaves the website. It is important, however, to keep it very brief and accessible; this can be achieved by using, for example, multiple-choice questions or by clicking on an emoticon.
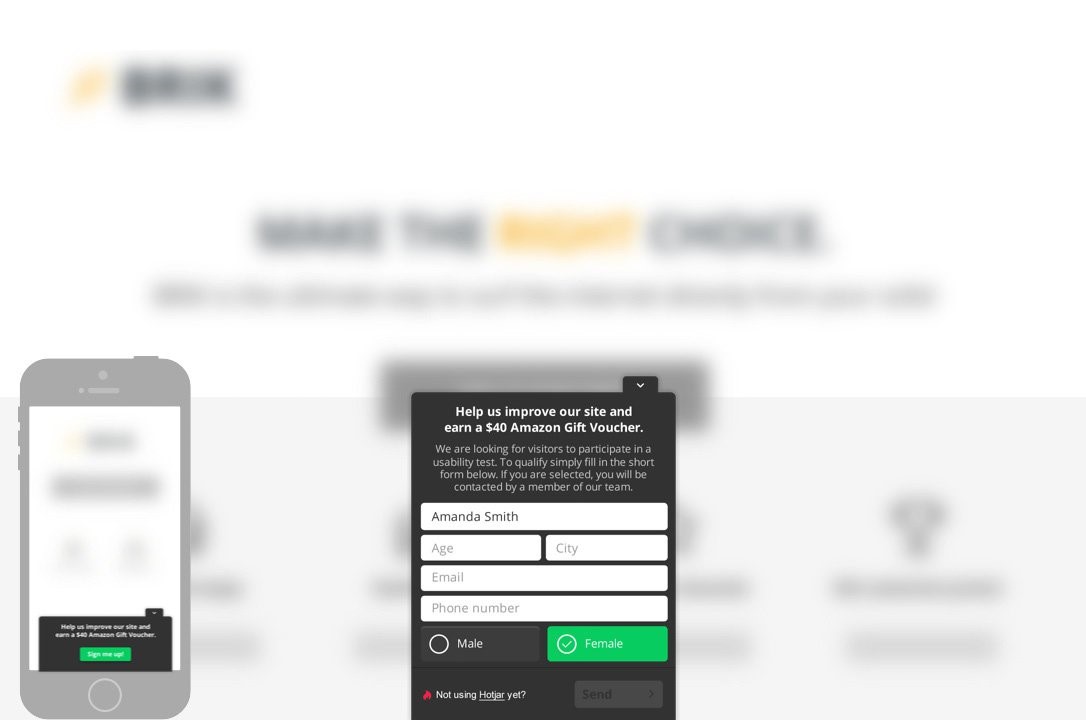
By using a survey, website visitors can be better profiled. In Hotjar, you can create your own responsive survey using a simple editor. This allows real-time responses to be collected from any device. For example, this can be used to gauge current customer satisfaction levels. Combining a heatmap with visitor recording can yield valuable insights. Our advice is not to do this too often. We usually recommend doing this no more than once a year, to prevent visitors from becoming annoyed.

For this purpose, the agency’s own website visitors can be used for user testing. A diverse test panel can be set up, comprising, for example, website visitors who have completed a conversion or those who abandoned the site at a certain point. Based on the composition of the test panel, targeted questions are asked to ensure the website is continuously improved. In most cases, participants in the test panel are offered a small fee to keep them motivated.
This blog discusses Hotjar’s features; we began with the three analysis options and concluded with the feedback options. Given the data that is collected, one might wonder whether it is GDPR-compliant. Fortunately, you needn’t worry about that. Hotjar works perfectly well under the new GDPR. It has become a little more complicated, though, as visitors must be asked for consent via cookies. In practice, we find that the cookies are usually accepted, giving us access to the valuable data from Hotjar.
Still not entirely convinced about using Hotjar? Then take a closer look!
By using Hotjar, a website can be designed to provide the best possible experience for visitors. Would you also like a website tailored to your visitors’ needs? Or do you need help with conversion optimisation for your website? We’d be delighted to help!




Our team is
ready to help you