Proud partner

Proud partner
Article


Optimising your website is a key way to get more out of it and thus increase your revenue. To test different versions of your website and landing pages, you can use the VWO tool: Visual Website Optimizer. By using VWO, visitor data can be analysed, giving you greater insight into visitor behaviour and allowing ideas to be tested before they are implemented. In this way, you can test whether the changes actually lead to an increase in conversion rates.
VWO offers various options for analysing your website. These analyses are a useful tool for optimising the user experience on your website. Using the various analysis tools provided by VWO, you can identify the pain points on your website. Based on these bottlenecks, you can start testing alternatives and eliminate the issues for the user. In this blog, we explain what analysis options are available and what they are used for.
Heatmaps in VWO provide virtual representations of how your website visitors behave on your site. From clicking on elements on your website, to a visitor’s scrolling behaviour through your page, to selecting an option within a drop-down menu – everything can be measured using this feature. VWO offers various heatmaps, each with a different function.
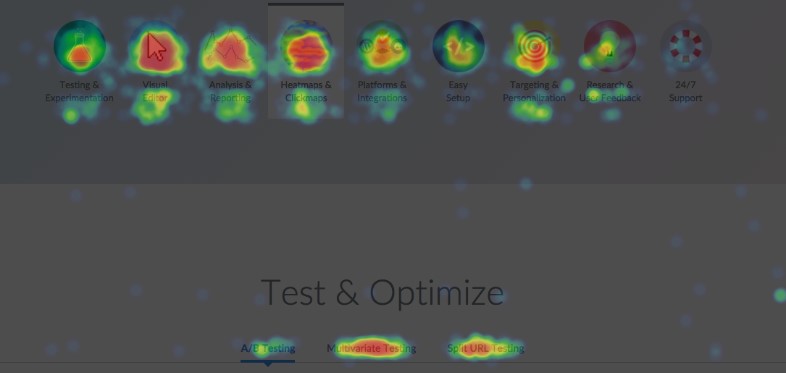
The image above shows an example of a dynamic heatmap. It is clear to see that different colours are used. The areas with the most interactions are highlighted in red, whilst the areas ranging from light blue to green are those with the fewest interactions. If, for example, you notice that an important category on your website is generating little interaction, you can design tests to improve that interaction. In addition to dynamic heatmaps, VWO also offers the following features:
In short: plenty of opportunities to analyse your visitors’ behaviour and optimise your site based on this. The next feature we’ll be discussing is: ‘Recordings’.
‘Recordings’ is also a feature that allows you to analyse your website using recordings you make on your site. With the ‘Recordings’ feature, you can literally look over the user’s shoulder and see how they behave on the website.
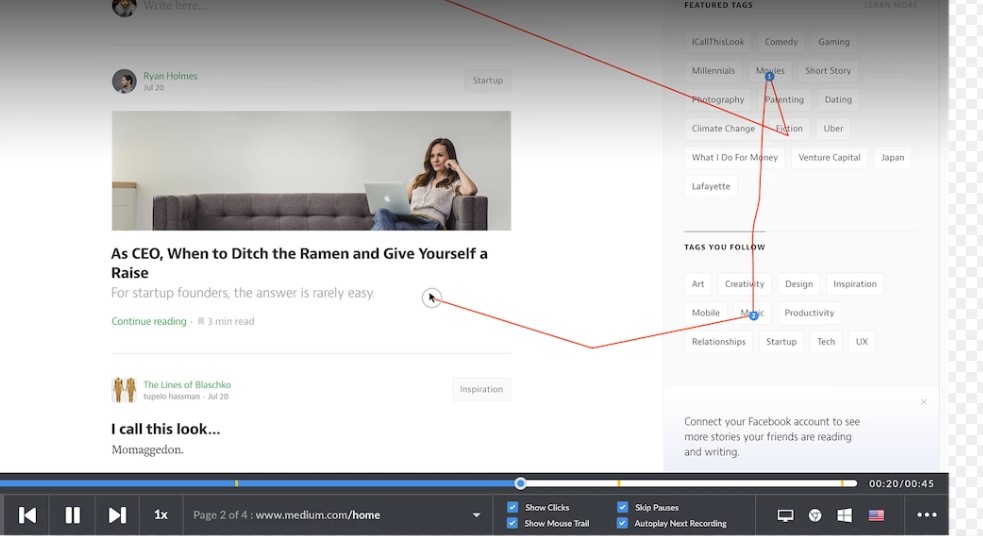
Within the ‘recordings’ section, VWO offers various features that can all be useful when analysing your website using visual data. We will discuss the following features:
By recording mouse movements and clicks – also known as mouse tracking – you can see exactly how users navigate your website. You can also see what users click on and how often they scroll up and down a page.
With the ‘pages and sessions’ feature, you can track a user’s behaviour on a specific page or across the pages the visitor views during a single session.
This feature allows you to set the recording speed. For example, if you want to see the behaviour of hundreds of people visiting your page, you’ll opt for a high speed. If you want to see exactly what each user is doing and which actions they’re taking, you’ll opt for a low speed.
If a user does not perform any actions for a while, you can skip part of the recording so that you can focus purely on the actual actions the user carries out.
Have you noticed unusual behaviour on a particular page or section of the website? If so, you can use this feature to add an observation, so that you can review this moment later.
Add notes to specific actions carried out by a user. This allows you to gain better insights into the situation.
The next feature we’ll be looking at is form analysis. This feature allows us to analyse forms on the website and determine how visitors use them, which fields they fill in and whether they encounter any problems.
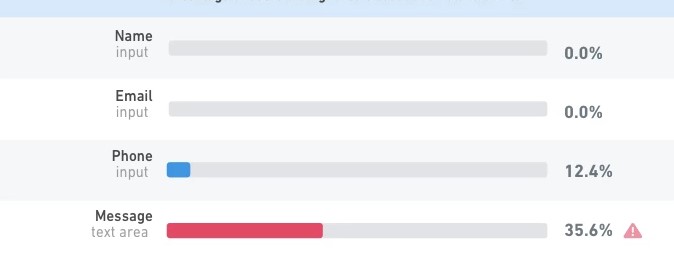
If, for example, you notice that many people leave the page whilst filling in forms, form analysis allows you to see exactly at which point they drop out. Form analysis also includes a number of very interesting features that will certainly help you to improve the forms on your website. We will be discussing the following features:
Have you noticed that visitors are taking a very long time to fill in a form on your website? There may well be a clear reason for this. Is your form too long? Are there errors in certain fields? With this feature, you can see exactly how long it takes a visitor to complete a form, and you can also see how long a visitor spends on a particular field. Using this information, you can optimise your forms so that your visitors spend less time filling them in.
This feature is very useful for determining whether certain fields in your form are being misinterpreted. It allows you to see what percentage of your visitors are re-entering data in specific fields. If you notice that a high percentage of your visitors frequently have to re-enter a particular field, it’s a good idea to test whether you can incorporate this field into your form in a different way.
This feature allows you to see, for each form, how many people land on a particular form, how many people interact with the form, and how many people actually submit it. Using this data, you can improve the conversion funnel for your forms, ensuring that more people who land on your forms actually complete and submit them.
Have you noticed that many visitors don’t complete a form at all? If so, you might want to try the ‘dropped’ feature. This allows you to see exactly how many people started filling in the form but didn’t submit it. You can also see at which field they dropped out.
The surveys feature allows you to set up short on-page questionnaires to ask visitors specific questions. This is an excellent way to find out why a visitor behaves in a certain way on a page.
For this role, it is very important that you display the surveys to visitors at the right moments, so that visitors are willing to take the trouble to actually complete the survey. Naturally, you don’t want visitors to have to complete a survey on every page, as this does not enhance the user experience.
You can set up surveys in various ways. VWO itself offers a number of triggers that cause a survey to be displayed to the visitor, but you can also build your own triggers using JavaScript. Some predefined triggers are:
There are many more triggers that you can set up in advance and even customise using JavaScript.
As well as the triggers, you can also ask different types of questions. Will you opt for open-ended questions, a tick box, a rating scale, or a drop-down menu with various options? So make sure you carefully consider in advance what sort of questions you want to ask and what information you wish to receive from the visitor. You can tailor both your question types and your triggers accordingly.
The following features are worth trying out when you start working with surveys in VWO:
‘Survey position’ refers to the ability to test where on the website a survey generates the most responses. There can indeed be a difference in the number of responses generated depending on whether a form is placed at the top, bottom, left or right of a page.
Just as with the recordings, you can also add observations to the surveys. This allows you to clearly see afterwards how visitors behave when completing a survey. Does anything noteworthy happen? If so, you can use this information to optimise the surveys.
As you’ve read, VWO offers a whole host of possibilities when it comes to analytics. You can extract a great deal of data from it, but what’s far more important is what you do with that data. VWO is also a very useful tool for this, because in addition to its analytical capabilities, it offers a number of very interesting testing options. That’s why we’ll be exploring this in more detail here, to show you which testing options you can use to improve your website.
With VWO, testing can be carried out in various ways. For example, an A/B test can be set up, but it is also possible to test multiple elements simultaneously. To keep things clear, we will discuss the three main options one by one.
A/B testing involves creating two or more versions of a web page or app. These are compared against one another to determine which version yields the highest conversion rate. The comparison between the pages is made by directing traffic to both pages. In this way, the performance of both pages is measured.
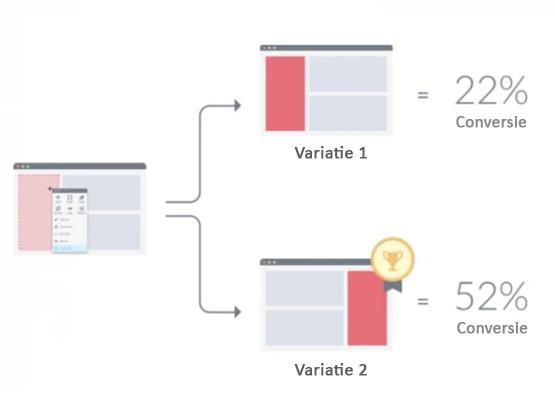
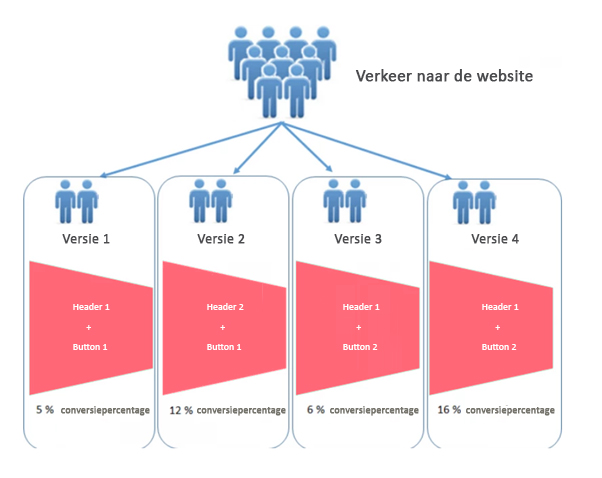
Another method is multivariate testing. This involves making multiple adjustments to a web page and creating variations for all possible combinations. Suppose you want to test both a header and a button. By using multivariate testing, you create one variation for the header and one variation for the button. To test all versions, you need to create a combination for all possible variations. For example:
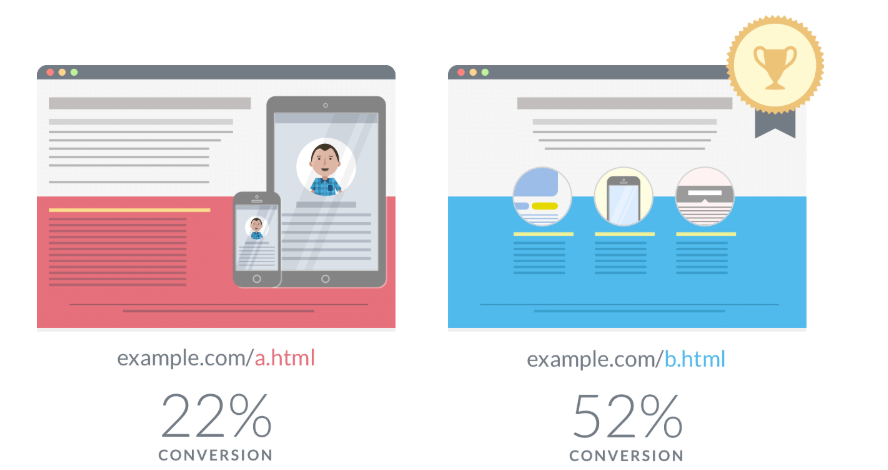
A third way to run tests is by using split testing. This involves testing different versions of the website, each hosted on a different URL. Website traffic is again distributed across the variations, and conversions are measured to determine which variation yields the best results. The main difference between A/B testing and split testing is that, in a split test, the variations are already hosted on different URLs. A/B testing is often used for front-end changes, whilst split testing is used when back-end or significant design changes are required.
All in all, VWO is therefore a very useful tool for analysing your website, but also for setting up various tests based on these analyses. All this with the aim of optimising your website for visitors. The following benefits therefore come with using VWO:
Would you also like to get started with Visual Website Optimizer and could you do with some help? We’d love to meet you for a cup of coffee to discuss the possibilities.




Our team is
ready to help you