Proud partner

Proud partner
Article
Summary


How do you bring complex information to life? That’s right, with an infographic. An infographic is an image incorporating other images and/or text. This form of content is very popular, and anyone can create an infographic. In this blog post from Traffic Today , we provide you with all the information about the infographic.
Before we delve deeper into the subject, it is worth knowing what an infographic is. An infographic is an image that incorporates, amongst other things, various images and text. It is not just a combination of text and images; it can also feature diagrams, quotes or other visual elements. Together, these provide a clear overview of a subject.
An infographic is often included with an article to clarify or reinforce its content, but can also be used as a lead magnet. The information from the article is then visualised. You can use this form of content for many different purposes: from annual reports to product descriptions. However, infographics are also used on their own. In such cases, they often take the form of larger images that combine various illustrations or charts to convey a broader message. In effect, they are a kind of mini-report.
The infographics can be divided into different categories. Each type is tailored to visualising a different type of content:
The most effective infographics are often creative and visually appealing. The reason for this is that they attract attention and stick in people’s minds. However, it is important that people do not simply remember the infographic because it looks good. The visuals must actually clarify the message or help people to remember something better.
Of all the information sent to our brains, 90 per cent is visual. This makes an infographic a means of conveying information more quickly. This method of communicating information has been used for a very long time; think, for example, of the Periodic Table of the Elements. This consists of squares with codes and colour codes. Maps, hieroglyphs and data visualisation using graphs and diagrams are also early examples of this approach.
Visuals and infographics are often confused with one another. The main difference is that an infographic provides more information in a clear or narrative format compared to a visual. Together, these form a coherent whole. A visual, on the other hand, is very simple and can be read or understood at a glance.
Content is information. You can use content in various ways, but also for different purposes. For example, you can entertain, persuade or inform people. But what is an infographic actually suitable for?
You’ve probably realised by now that an infographic is effective. But what exactly are the benefits of this form of content? Firstly, it makes complex matters easier to understand by explaining them in a creative and visual way. It also contributes to optimisation for your organisation. Let us explain.
An eye-catching infographic improves your website’s discoverability. Because it often looks clear and straightforward, people are more likely to click on it. As a result, more people visit your page.
By using infographics on your FAQ (frequently asked questions) page, you make it easier for customers to find the information they’re looking for. This ensures that customers find the information they need on your website. They’ll find their answers more quickly, and you’ll spend less time dealing with them via customer service. A win-win!
Infographics can also be a perfect addition to your internal communications. They make complex information clearer for colleagues. They also mean colleagues no longer have to read endless texts. Furthermore, you can effectively incorporate research findings or annual reports into this type of content.
To create a good infographic, it is important to stay focused on the subject. Get to the heart of your story. There are also a number of other points you might want to bear in mind:
Before you start creating an infographic, it is important to identify the key points of your content. You should also think about the titles and headings you are going to use. What information do you want to include, and is that the information that is essential for the user? If you’re going to use text, it’s a good idea to consider the length of the text. After all, you don’t want to include paragraphs full of text in the infographic: keep it short and to the point, whilst still ensuring it’s understandable. Once you’ve decided on all this, it’s time to think about the design. If you’re not designing the infographic yourself, make sure you provide the designer with enough information so that they can create a good layout for your infographic. After all, a good start is half the battle.
If you’re designing an infographic yourself, it’s important to incorporate patterns. You use these to structure and organise the (visual) material. This makes it easier for the user to understand the message. You create structure by using shapes. Think of lines and borders to group information. For example, you can also use circles or squares to organise your content more effectively. Thanks to this structure, users find it easier to understand the content.
Another important aspect of creating an infographic is colour. Colour allows you to draw attention precisely to specific information you wish to highlight or that supports the message you want to convey. For example, do you want to emphasise certain words? Then use a colour that contrasts with the other colours in your infographic. If, for instance, you’re mainly using dark colours, such as grey and black, you could use red as a contrasting colour.
Fonts can make or break your infographic. It is therefore important to choose a font that complements the rest of your design. It is important to select no more than three fonts: one for the subject matter, one for the headings and one for the body text. This helps to add extra structure.
To make your infographic even more effective, you can use images, illustrations and icons. You’ll want to focus on these in particular, as visual content is the most important element in your infographic. We’ve listed various types of visual content for you below:
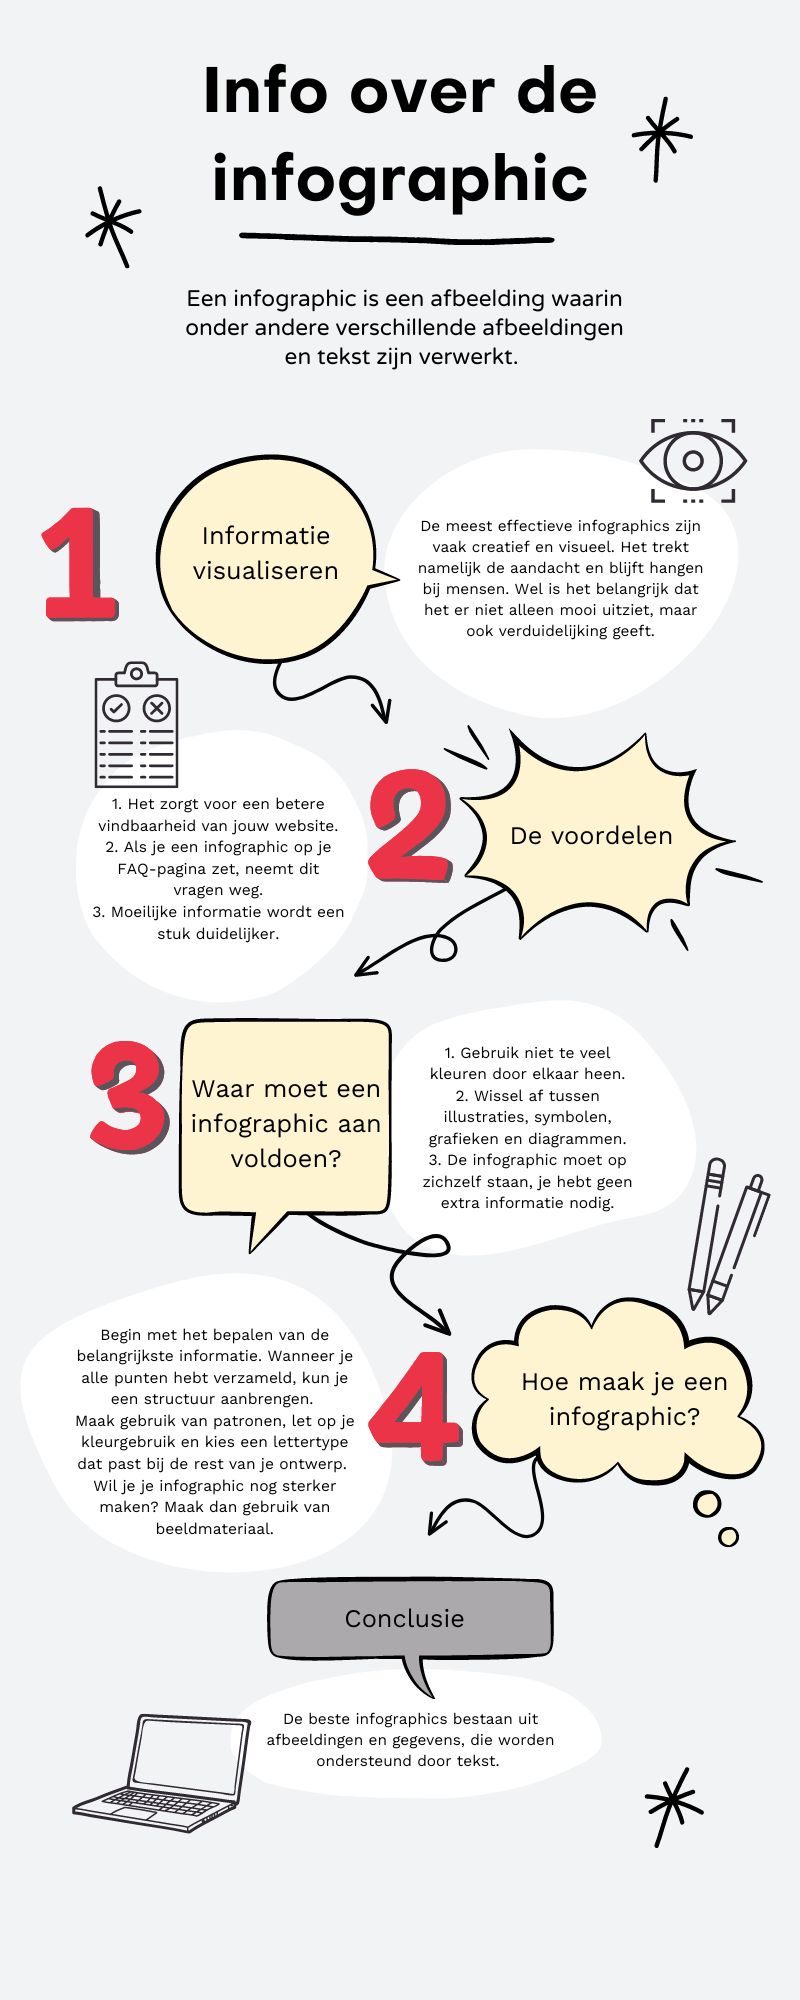
The best infographics therefore consist of images and data, supported by text. Because they are so effective, they make a stronger impression on the target audience. You should therefore also use infographics to share important information.




Our team is
ready to help you